
Italian football has a reputation for caution that fans of other leagues repeat without checking. Ten seasons of results say the reputation is roughly fair, and they also show where Milan sit inside it, which is a less flattering and more interesting place than a comparison with the league average suggests.
From 2016/17 to 2025/26 Serie A produced 3,800 completed matches and 47 distinct final scores. England produced 50 over the same period and the Eredivisie 52. Spain, Belgium and Turkey also recorded 47, and only Portugal, with 45, had fewer. The ten most frequent Italian scorelines account for 74.03% of all results.
What a Serie A match usually looks like
| Score (home first) | Share of matches |
| 1–1 | 11.87% |
| 1–0 | 9.16% |
| 2–1 | 9.05% |
| 1–2 | 7.82% |
| 0–1 | 7.71% |
| 0–0 | 6.79% |
| 2–0 | 6.76% |
| 2–2 | 5.66% |
Serie A averages 2.74 goals a match. Of the nine European leagues in this comparison, three score less: Ligue 1 at 2.73, Spain at 2.62 and Portugal at 2.59. Germany and the Netherlands both sit near 3.10. Italy stands out more for how close its matches are. A one-goal margin settled 39.26% of fixtures and 25.53% ended level. One side reached four goals in 10.97% of Serie A matches, against 16.70% in the Bundesliga.
Home advantage is the other distinguishing figure. Home sides won 41.95% of Serie A matches over the decade, the lowest of the nine leagues; Spain is at 45.50% and England at 44.63%. The Italian figure has also been falling. It was 48.42% in 2016/17 and has been below 40% in three of the last five seasons.
Milan at San Siro, against the league and against their rivals
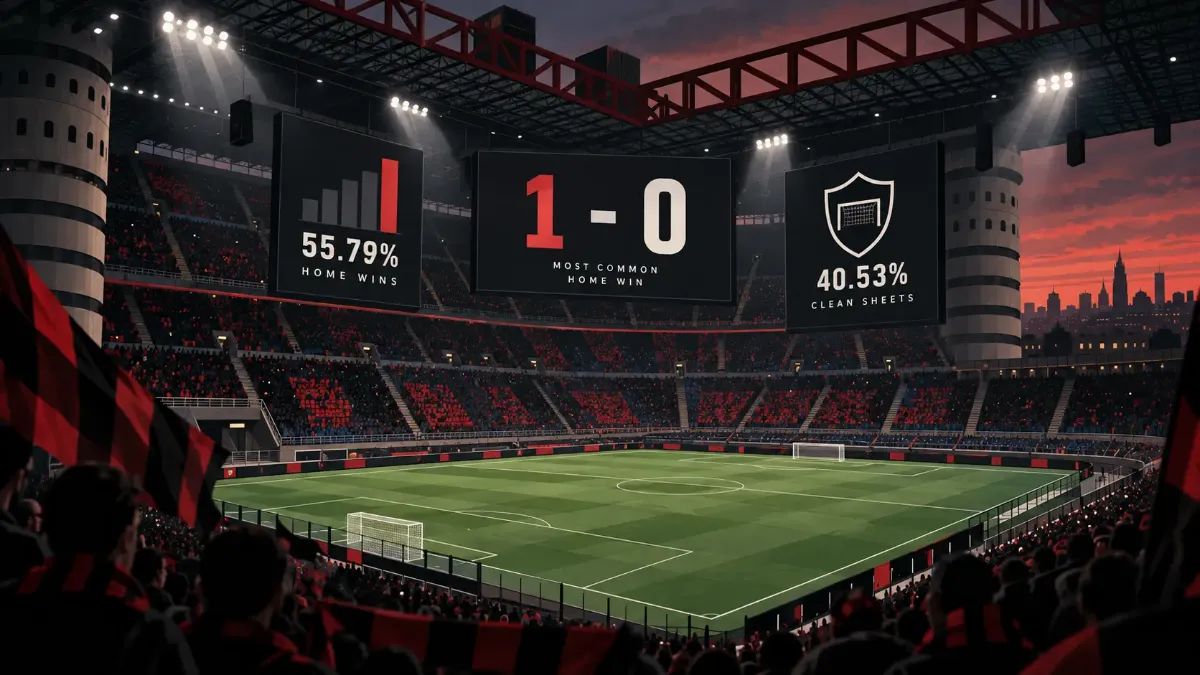
Milan played 190 league matches at San Siro across those ten seasons. Set against the league average they look dominant: 55.79% home wins against 41.95%, and a clean sheet in 40.53% of home matches against 29.26% for Serie A home sides as a whole. That comparison flatters any big club, so the fairer test is against the other sides that spent all ten seasons in the division and regularly finished in the top half.
| Club, home league matches | Home wins | Clean sheets | Won 1–0 | Goals per match |
| Juventus | 70.53% | 47.89% | 12.11% | 2.68 |
| Inter | 68.42% | 42.63% | 11.05% | 3.06 |
| Roma | 63.68% | 38.95% | 14.74% | 2.88 |
| Napoli | 63.16% | 34.74% | 8.42% | 2.95 |
| Milan | 55.79% | 40.53% | 14.74% | 2.61 |
| Lazio | 54.21% | 32.63% | 11.05% | 3.04 |
| Atalanta | 52.63% | 31.58% | 7.37% | 3.07 |
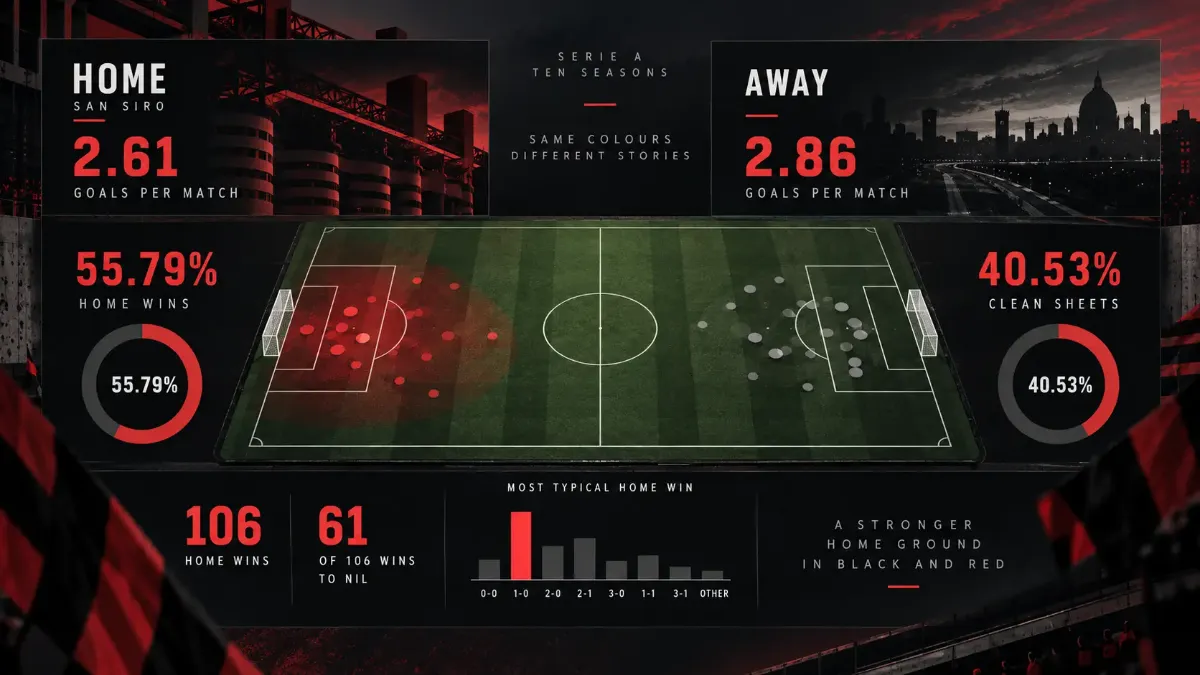
Each club played 190 home matches. Against this group Milan's home record is ordinary. Four clubs won more often at home, and both Juventus and Inter kept more clean sheets. Where Milan stand apart is in how few goals their home matches contained: 2.61 a game, the lowest of the seven and below the league average of 2.74, while Inter, Lazio and Atalanta all ran above 3.00. The 1–0 home win turned up in 14.74% of Milan's matches at San Siro, 28 of 190, level with Roma for the highest share in the group and well above the league's 9.16%.
Of Milan's 106 home wins, 61 came with a clean sheet, which is 57.55%. After 1–0, the next most frequent home result was 2–0 at 10.53%. Over a decade, the typical Milan home win has been narrow and built on not conceding.
Away from San Siro the matches opened up. Milan's away fixtures averaged 2.86 goals, a quarter of a goal more than at home. They scored at almost the same rate on the road, 1.66 a match against 1.64, and conceded 1.20 against 0.96. They still won 51.58% of away matches, and the single most common away result was a 2–1 Milan win, which happened 26 times.
How much weight these club figures can bear
A sample of 190 matches leaves wide margins. Milan's 1–0 share carries a 95% range of roughly 10% to 20%, which still clears the league figure of 9.16%, and the clean-sheet and home-win gaps over the league average are also larger than sampling error. Milan's rate of goalless home draws is a different case. It was 8.42% against a league rate of 6.79%, which amounts to sixteen matches, too few to separate from the league average, so it is left out of the comparison above.
The league-wide figures move a lot from year to year as well. Across the ten seasons the share of 2–1 results ranged from 5.79% to 12.37%, the share of 1–0 from 5.53% to 11.32%, and the most common result, 1–1, from 9.47% to 14.21%. A season in which Milan seem to win every home match 1–0, or one in which nothing finishes goalless, sits inside that normal range. An early-season run of three or four results sits even further inside it.
Reading an injury list with this in mind
The standard academic model of football scores, set out by Mark Dixon and Stuart Coles in Modelling Association Football Scores and Inefficiencies in the Football Betting Market, gives every club a separate attack parameter and defence parameter. The paper works at club level and says nothing about individual players, so what follows is an inference from that structure: an absence is more naturally read as a change to one of those two parameters than as a change to the whole fixture.
For a side whose home matches have been low-scoring and often settled 1–0, the defensive parameter is where a change would show most. That is a reading of the figures above. Nothing in this data measures the effect of any individual player.
The full Serie A frequency table, the season-by-season ranges and the same breakdown for eight other leagues are published at footballcorrectscore.com.
Method. Full-time league results for Serie A, seasons 2016/17 to 2025/26, 3,800 matches, compiled from football-data.co.uk by footballcorrectscore.com. Scores are as played on the pitch, so a match later awarded by a sporting tribunal is counted with its on-field score. League averages include Milan's own matches. The club table lists sides present in all ten seasons. Ranges quoted for Milan are 95% Wilson intervals. Percentages are rounded to two decimals.